Integrations and API
The strategy layer above operations.
BlueJam brings the strategy together without replacing the systems where the operational data lives. Direction and priorities are distributed across the organization, while results and analytics come in through the API, Power BI and integrations.
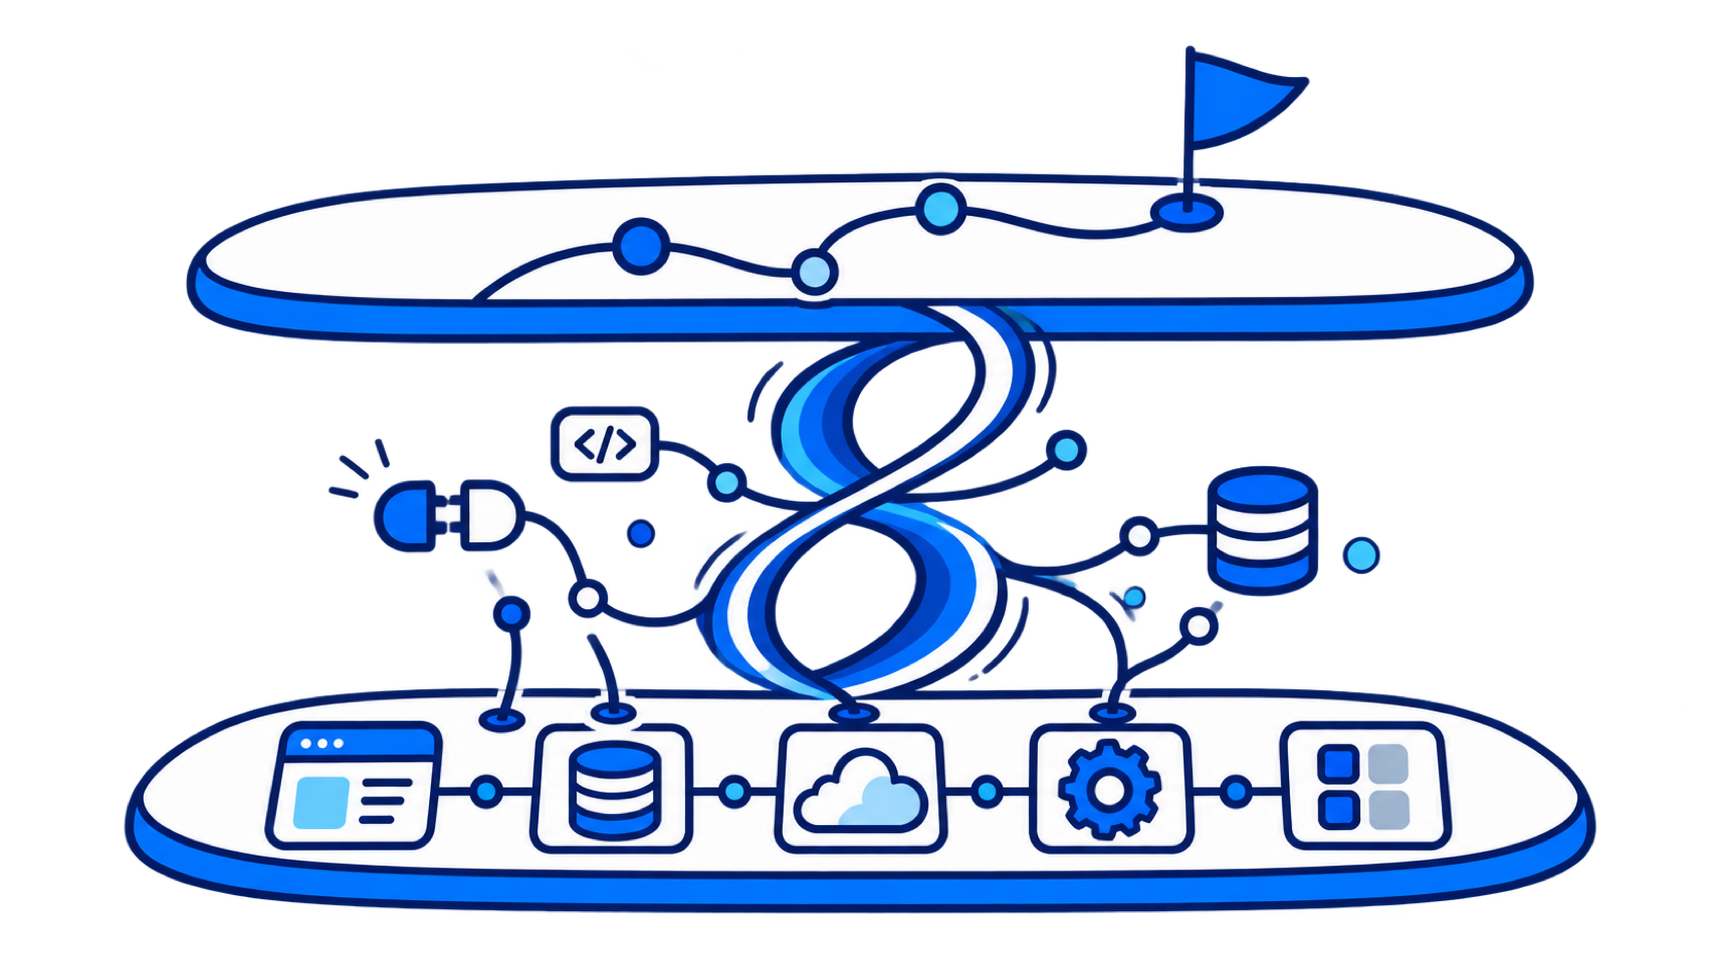
Running inside IT environments with demanding security and administration requirements






Challenges
The numbers exist, but not where decisions are made.
The result data already sits in finance, HR, project and line-of-business systems. The challenge is connecting it to the objectives, assessments and decisions it is meant to inform.
Data without strategic context
The figure exists. The connection does not.
Operational data shows what has happened, but not always which strategic objective the result affects. When data and strategy live apart, the connection has to be explained again in every meeting.
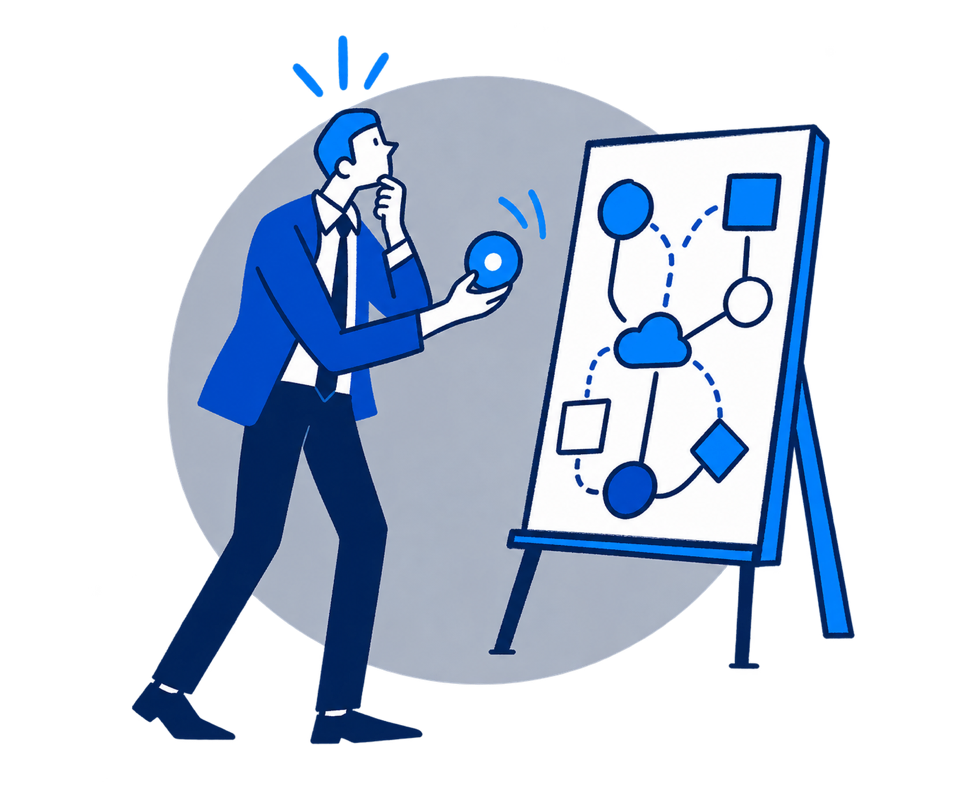
Manual reporting
The work goes into collecting, not assessing.
Every reporting round starts by pulling figures from several sources and pasting them in again. Governance information goes stale quickly, and the time goes into collection rather than assessment.

Integration as a major project
Everything has to be connected before anything is used.
When the integrations are planned as one large technology effort, both the complexity and the time to value grow. The needs get clearer when the sources are connected step by step.

Solution
Direction down, data up.
The strategy is governed in BlueJam. Results and analytics come from the systems where they already live, and are shown alongside the objectives they are meant to inform.
How it works
Connect one source at a time.
A stepwise approach gives early value and reduces the complexity of the setup.

Clarify the information need
Choose which objectives and indicators need data, where the data lives and how often it should update.

Connect the source
The source system connects to BlueJam’s REST API, or existing Power BI analyses are embedded where they will be used.

Extend as needed
Start with the integration that gives the most value, and add sources and use cases without setting everything up at once.

Clarify the information need
Choose which objectives and indicators need data, where the data lives and how often it should update.
Extend as needed
Start with the integration that gives the most value, and add sources and use cases without setting everything up at once.
Connect the source
The source system connects to BlueJam’s REST API, or existing Power BI analyses are embedded where they will be used.
Integrations and API
Connect BlueJam to the systems you already use.
Bring data in, make strategy data available in other systems and show existing analyses where they will be used. Open interfaces make it possible to start simply and extend as needed.
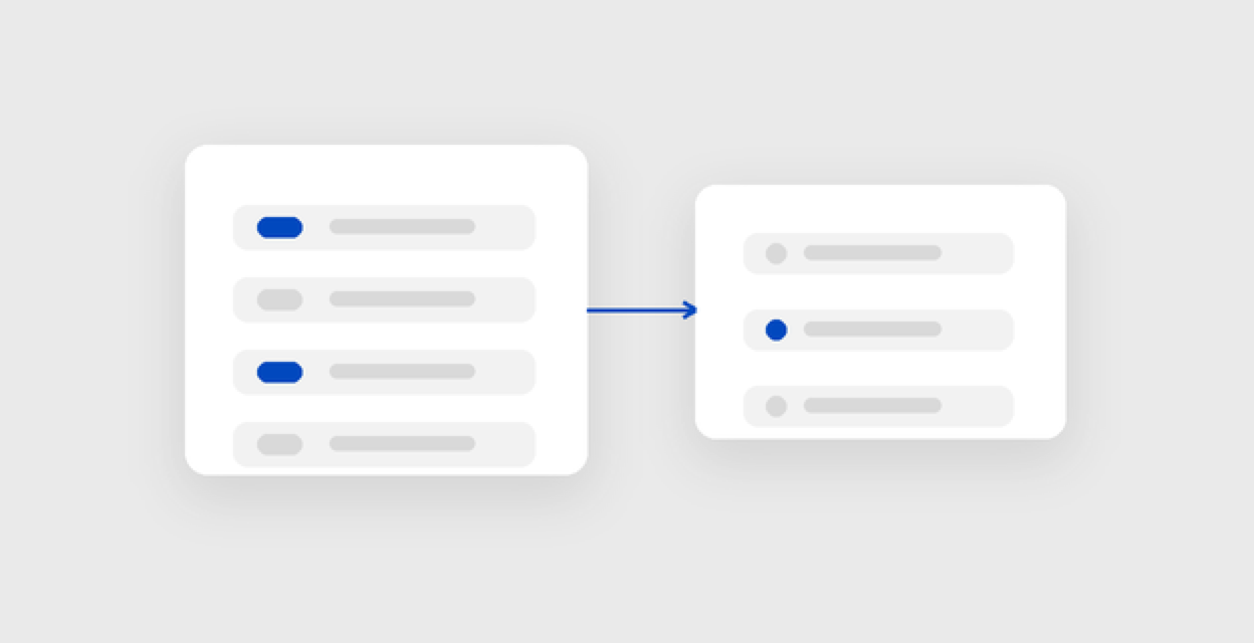
A documented REST API
Pull objectives, indicators, initiatives, actions and risk from BlueJam, or update result data from your own systems.
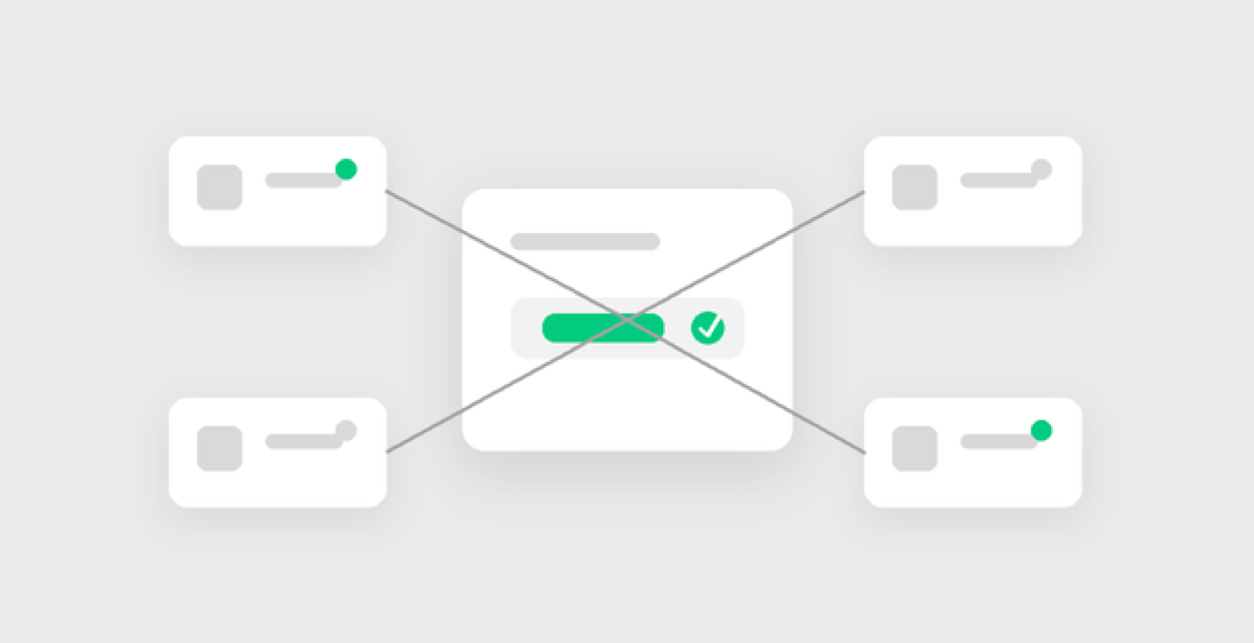
Current figures from the source
Pull values from finance, HR, project and domain systems and pre-fill them at check-in. The objective owner can spend the time judging the trend, not hunting for the figure.

Embedded Power BI reports
Show existing Power BI reports on an individual indicator or as a combined dashboard under Insight - without rebuilding the analyses.

Microsoft Teams
Make objectives, status and check-ins available in Microsoft Teams, where many people already work and collaborate every day.

Export to PowerPoint and PDF
Take current governance views and reports on to the board, the leadership team, the owner or the parent authority in PowerPoint or PDF.
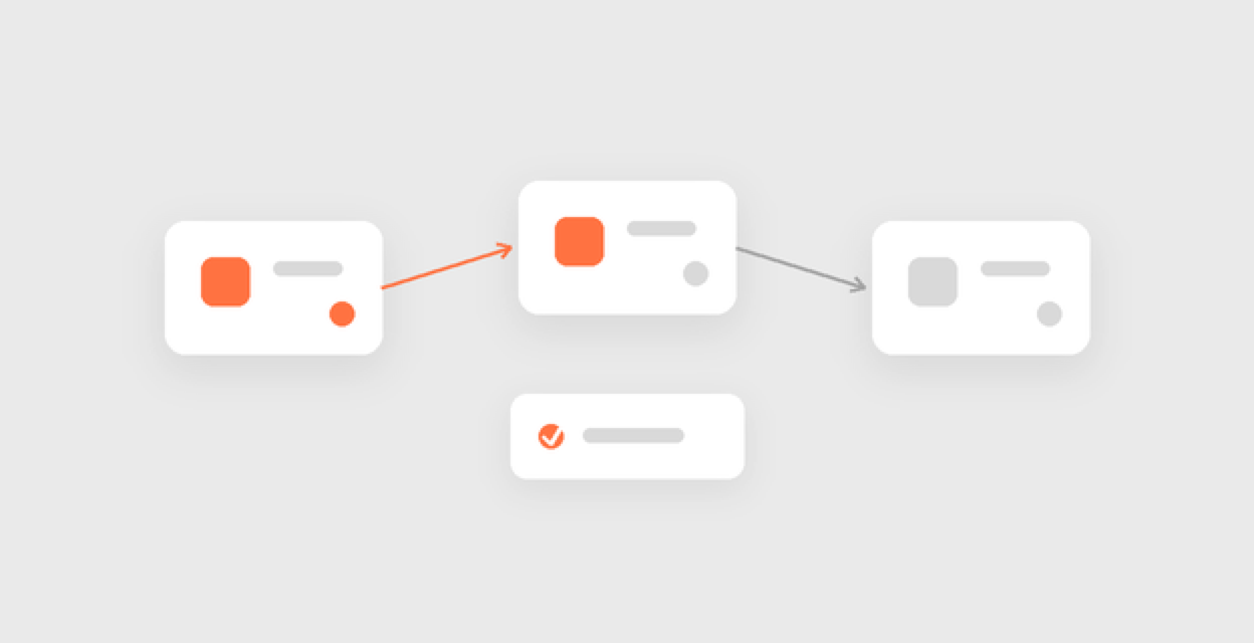
Stepwise setup
Prioritize the integrations by need and value. Connect and verify one source at a time before the next part of the integration work starts.

Benefits
Fits in, rather than sitting alongside.
Fresher governance information
When the values come from the source, status is current before the meeting starts - not just as of the last time someone copied the figure.
Less manual work
The reporting round starts with the assessment. Effort moves from finding and compiling figures to explaining what they mean.
Strategy and operations in one view
Objectives, results and analytics are shown together, so the governance dialogue can be about trends, variance and decisions.
Does IT need to assess sign-in and security?
See Security and identity
See how BlueJam fits into your IT landscape.
We walk through the API, data sources, Power BI and the relevant integrations together with IT.
Platform
Enterprise Strategy
Function-Level Strategy
Multi-Business Strategy
AI for Strategy
Integrations & API
Security & Identity
Pricing
Solutions
Strategy Development
Strategy Execution
Strategy Engagement
Strategy Insights
Results-Based Management
Strategic Risk Management
OKRs
Balanced Scorecard
Public Sector
BlueJam for the Public Sector
Public Sector Governance
Managing for Results
Strategy Execution
Risk Management & Internal Control
The world’s most fun and engaging strategy platform for all employees.
Follow us
Platform
Enterprise Strategy
Function-Level Strategy
Multi-Business Strategy
AI for Strategy
Integrations & API
Security & Identity
Pricing
Solutions
Strategy Development
Strategy Execution
Strategy Engagement
Strategy Insights
Results-Based Management
Strategic Risk Management
OKRs
Balanced Scorecard